
15 Accounting
Accounting: More than Numbers
Accounting is the process of collecting, recording, classifying, summarizing, reporting, and analyzing financial activities. It results in reports that describe the financial condition of an organization. All types of organizations—businesses, hospitals, schools, government agencies, and civic groups—use accounting procedures. Accounting provides a framework for looking at past performance, current financial health, and possible future performance. It also provides a framework for comparing the financial positions and financial performances of different firms.
Who Uses Financial Reports?
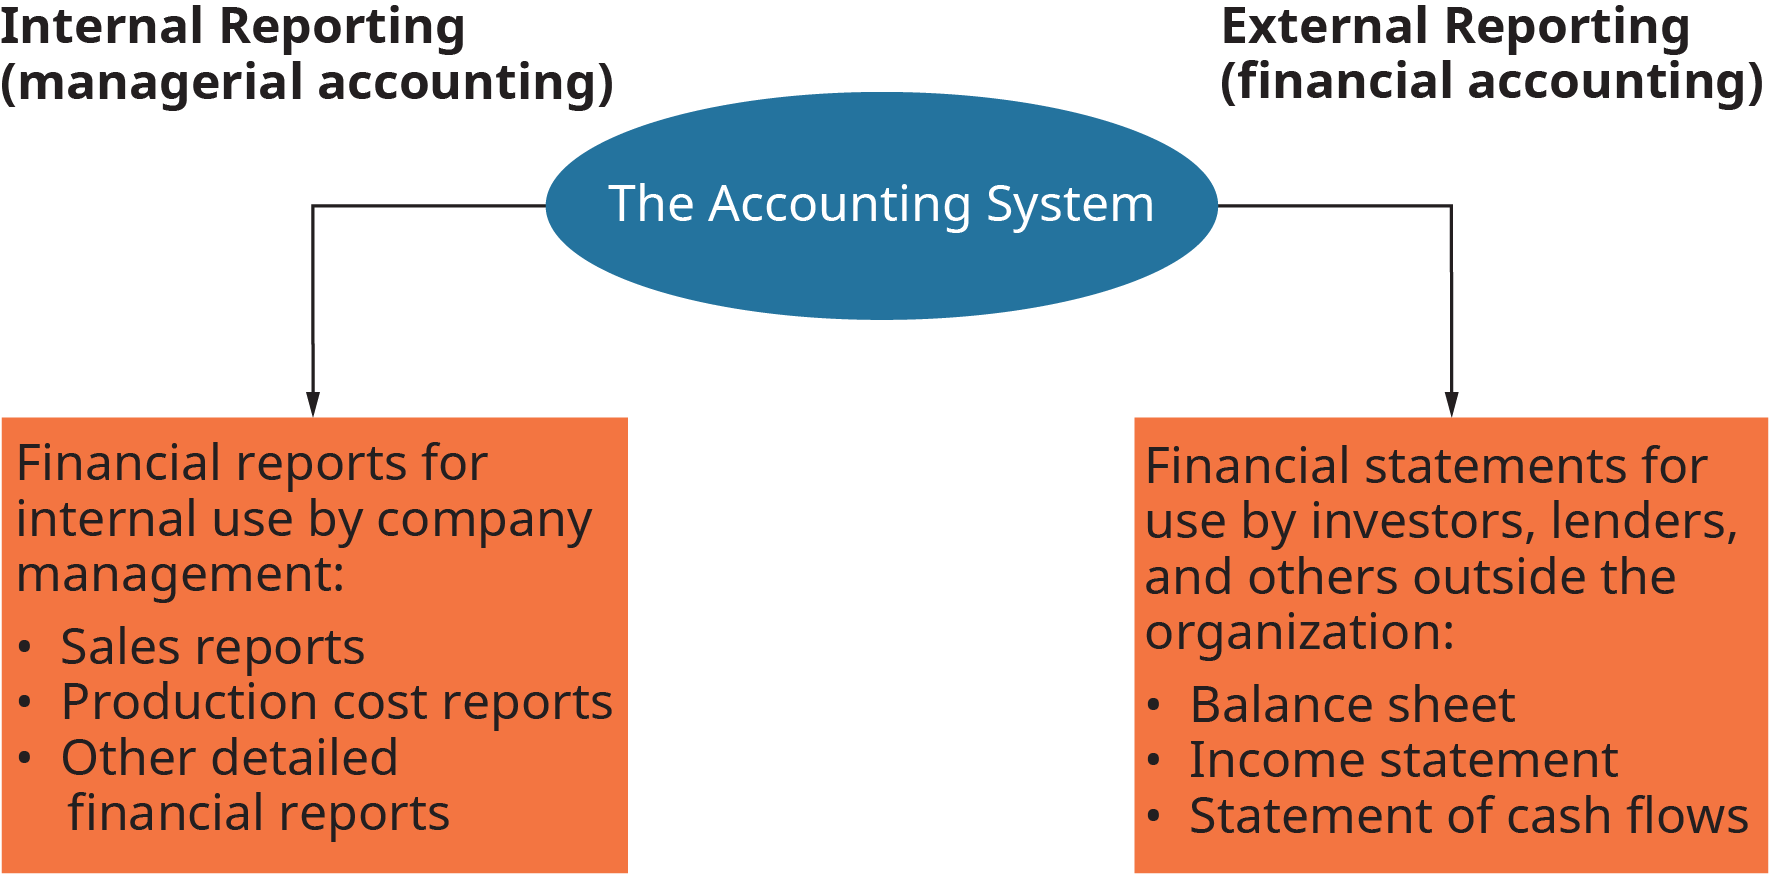
The accounting system generates two types of financial reports: internal and external (Figure 15.2). Internal reports are used within the organization. As the term implies, managerial accounting provides financial information that managers inside the organization can use to evaluate and make decisions about current and future operations. For instance, the sales reports prepared by managerial accountants show how well marketing strategies are working, as well as the number of units sold in a specific period of time. This information can be used by a variety of managers within the company in operations as well as in production or manufacturing to plan future work based on current financial data. Production cost reports can help departments track and control costs, as well as zero in on the amount of labor needed to produce goods or services. In addition, managers may prepare very detailed financial reports for their own use and provide summary reports to top management, providing key executives with a “snapshot” of business operations in a specific timeframe.
Financial accounting focuses on preparing external financial reports that are used by outsiders; that is, people who have an interest in the business but are not part of the company’s management. Although they provide useful information for managers, these reports are used primarily by lenders, suppliers, investors, government agencies, and others to assess the financial strength of a business.
Basic Accounting Procedures
Financial statements are the chief element of the annual report, a yearly document that describes a firm’s financial status. Annual reports usually discuss the firm’s activities during the past year and its prospects for the future.
Three primary financial statements included in the annual report are:
- The balance sheet
- The income statement (or statement of operations)
- The statement of cash flows
Using generally accepted accounting principles (GAAP), accountants record and report financial data in similar ways for all firms. They report their findings in financial statements that summarize a company’s business transactions over a specified time period.
The Accounting Equation
The accounting procedures used today are based on those developed in the late 15th century by an Italian monk, Brother Luca Pacioli. He defined the three main accounting elements as assets, liabilities, and owners’ equity. Assets are things of value owned by a firm. They may be tangible, such as cash, equipment, and buildings, or intangible, such as a patent or trademarked name. Liabilities—also called debts—are what a firm owes to its creditors. Owners’ equity is the total amount of investment in the firm minus any liabilities. Another term for owners’ equity is net worth.
The relationship among these three elements is expressed in the accounting equation:
|
Assets |
– |
Liabilities |
= |
Owners’ equity |
This equation can also be written as follows:
|
Assets |
= |
Liabilities |
+ |
Owners’ equity |
The accounting equation must always be in balance (that is, the total of the elements on one side of the equals sign must equal the total on the other side).
Suppose you start a coffee shop and put $10,000 in cash into the business. At that point, the business has assets of $10,000 and no liabilities. This would be the accounting equation:
|
Assets |
= |
Liabilities |
+ |
Owners’ equity |
|
$10,000 |
= |
$0 |
+ |
$10,000 |
The liabilities are zero and owners’ equity (the amount of your investment in the business) is $10,000. The equation balances.
To keep the accounting equation in balance, every transaction must be recorded as two entries. As each transaction is recorded, there is an equal and opposite event so that two accounts or records are changed. This method is called double-entry bookkeeping.
Suppose that after starting your business with $10,000 cash, you borrow another $10,000 from the bank. The accounting equation will change as follows:
|
Assets |
= |
Liabilities |
+ |
Owners’ equity |
|
|
$10,000 |
= |
$0 |
+ |
$10,000 |
Initial equation |
|
$10,000 |
= |
$10,000 |
+ |
$0 |
Borrowing transaction |
|
$20,000 |
= |
$10,000 |
+ |
$10,000 |
Ending equation |
Now you have $20,000 in assets—your $10,000 in cash and the $10,000 loan proceeds from the bank. The bank loan is also recorded as a liability of $10,000 because it’s a debt you must repay. Making two entries keeps the equation in balance.
Before continuing, take a moment to practice the accounting equation:
The Balance Sheet

The balance sheet, one of three financial statements generated from the accounting system, summarizes a firm’s financial position at a specific point in time. It reports the resources of a company (assets), the company’s obligations (liabilities), and the difference between what is owned (assets) and what is owed (liabilities), or owners’ equity.
The assets are listed in order of their liquidity, the speed with which they can be converted to cash. The most liquid assets come first, and the least liquid are last. Because cash is the most liquid asset, it is listed first. Buildings, on the other hand, have to be sold to be converted to cash, so they are listed after cash. Liabilities are arranged similarly: liabilities due in the short term are listed before those due in the long term.
The balance sheet as of December 31, 2022, for Delicious Desserts, Inc., a fictitious bakery, is illustrated in Table 15.1. The basic accounting equation is reflected in the three totals highlighted on the balance sheet: assets of $148,900 equal the sum of liabilities and owners’ equity ($70,150 + $78,750). The three main categories of accounts on the balance sheet are explained below.
|
Delicious Desserts, Inc. Balance Sheet as of December 31, 2022 |
|||
|
Assets |
|
|
|
|
Current Assets |
|
|
|
| Cash |
15,000 |
|
|
|
Marketable securities |
4,500 |
|
|
|
Accounts receivable |
45,000 |
|
|
|
Less: Allowance for doubtful accounts |
1,300 |
43,700 |
|
|
Notes receivable |
5,000 |
|
|
|
Inventory |
15,000 |
|
|
|
Total current assets |
|
83,200 |
|
|
Fixed Assets |
|||
|
Bakery equipment |
56,000 |
|
|
|
Less: Accumulated depreciation |
16,000 |
40,000 |
|
|
Furniture and fixtures |
18,450 |
|
|
|
Less: Accumulated depreciation |
4,250 |
14,200 |
|
|
Total fixed assets |
|
|
54,200 |
|
Intangible assets |
|
|
|
|
Trademark |
4,500 |
|
|
|
Goodwill |
7,000 |
|
|
| Total intangible assets |
|
11,500 |
|
| Total Assets |
|
148,900 |
|
|
Liabilities and owners’ equity |
|
|
|
|
Liabilities |
|
|
|
|
Current liabilities |
|
|
|
|
Accounts payable |
30,650 |
|
|
|
Notes payable |
15,000 |
|
|
|
Accrued expenses |
4,500 |
|
|
|
Income taxes payable |
5,000 |
|
|
|
Current portion of long-term debt |
5,000 |
|
|
|
Total current liabilities |
|
60,150 |
|
|
Long-term liabilities |
|
|
|
|
Bank loan for bakery equipment |
10,000 |
|
|
|
Total long-term liabilities |
|
10,000 |
|
|
Total liabilities |
|
|
70,150 |
|
Owners’ equity |
|
|
|
|
Common stock (10,000 shares outstanding) |
|
30,000 |
|
|
Retained earnings |
|
48,750 |
|
|
Total owners’ equity |
|
|
78,750 |
|
Total liabilities and owners’ equity |
|
|
148,900 |
Assets
Assets can be divided into three broad categories: current assets, fixed assets, and intangible assets. Current assets are assets that can or will be converted to cash within the next 12 months. They are important because they provide the funds used to pay the firm’s current bills. They also represent the amount of money the firm can quickly raise. Current assets include:
Cash: Funds on hand or in a bank.
Marketable securities: Temporary investments of excess cash that can readily be converted to cash.
Accounts receivable: Amounts owed to the firm by customers who bought goods or services on credit.
Notes receivable: Amounts owed to the firm by customers or others to whom it lent money.
Inventory: Stock of goods being held for production or for sale to customers.

Fixed assets are long-term assets used by the firm for more than a year. They tend to be used in production and include land, buildings, machinery, equipment, furniture, and fixtures. Except for land, fixed assets wear out and become outdated over time. Thus, they decrease in value every year. This declining value is accounted for through depreciation.
Depreciation is the allocation of the asset’s original cost to the years in which it is expected to produce revenues. A portion of the cost of a depreciable asset—a building or piece of equipment, for instance—is charged to each of the years in which it is expected to provide benefits. This practice helps match the asset’s cost against the revenues it provides. Because it is impossible to know exactly how long an asset will last, estimates are used. They are based on past experience with similar items or IRS guidelines for assets of that type. Notice that, through 2022, Delicious Desserts has taken a total of $16,000 in depreciation on its bakery equipment (Figure 15.4).
Intangible assets are long-term assets with no physical existence. Common examples are patents, copyrights, trademarks, and goodwill. Patents and copyrights shield the firm from direct competition, so their benefits are more protective than productive. For instance, no one can use more than a small amount of copyrighted material without permission from the copyright holder. Trademarks are registered names that can be sold or licensed to others. One of Delicious Desserts’ intangible assets is a trademark valued at $4,500. Goodwill occurs when a company pays more for an acquired firm than the value of its tangible assets. Delicious Desserts’ other intangible asset is goodwill of $7,000.
Liabilities
Liabilities are the amounts a firm owes to creditors. Those liabilities coming due sooner—current liabilities—are listed first on the balance sheet, followed by long-term liabilities.
Current liabilities are those due within a year of the date of the balance sheet. These short-term claims may strain the firm’s current assets because they must be paid in the near future. Current liabilities include:
Accounts payable: Amounts the firm owes for credit purchases due within a year. This account is the liability counterpart of accounts receivable.
Notes payable: Short-term loans from banks, suppliers, or others that must be repaid within a year. For example, Delicious Desserts has a six-month, $15,000 loan from its bank that is a note payable.
Accrued expenses: Expenses, typically for wages and taxes, that have accumulated and must be paid at a specified future date within the year although the firm has not received a bill.
Income taxes payable: Taxes owed for the current operating period but not yet paid. Taxes are often shown separately when they are a large amount.
Current portion of long-term debt: Any repayment on long-term debt due within the year. Delicious Desserts is scheduled to repay $5,000 on its equipment loan in the coming year.
Long-term liabilities come due more than one year after the date of the balance sheet. They include bank loans (such as Delicious Desserts’ $10,000 loan for bakery equipment), mortgages on buildings, and the company’s bonds sold to others.
Owners’ Equity
Owners’ equity is the owners’ total investment in the business after all liabilities have been paid. For sole proprietorships and partnerships, amounts put in by the owners are recorded as capital. In a corporation, the owners provide capital by buying the firm’s common stock. For Delicious Desserts, the total common stock investment is $30,000. Retained earnings are the amounts left over from profitable operations since the firm’s beginning. They are total profits minus all dividends (distributions of profits) paid to stockholders. Delicious Desserts has $48,750 in retained earnings.
Before continuing, take a moment to practice classifying asset, liability, and equity terms into the correct category:
The Income Statement
The balance sheet shows the firm’s financial position at a certain point in time. The income statement summarizes the firm’s revenues and expenses and shows its total profit or loss over a period of time. Most companies prepare monthly income statements for management and quarterly and annual statements for use by investors, creditors, and other outsiders. The primary elements of the income statement are revenues, expenses, and net income (or net loss). The income statement for Delicious Desserts for the year ended December 31, 2022, is shown in Table 15.2.
|
Delicious Desserts, Inc. Income Statement for the Year Ending December 31, 2022 |
|||
|
Revenues |
|
|
|
|
Gross sales |
|
275,000 |
|
|
Less: Sales discounts |
|
2,500 |
|
|
Less: Returns and allowances |
|
2,000 |
|
|
Net Sales |
|
|
270,500 |
|
Cost of Goods Sold |
|
|
|
|
Beginning inventory, January 1 |
18,000 |
|
|
|
Cost of goods manufactured |
109,500 |
|
|
|
Total cost of goods available for sale |
|
127,500 |
|
|
Less: Ending inventory December 31 |
|
15,000 |
|
|
Cost of Goods Sold |
|
|
112,500 |
|
Gross Profit |
|
|
$158,000 |
|
Operating Expenses |
|
|
|
|
Selling expenses |
|
|
|
|
Sales salaries |
31,000 |
|
|
|
Advertising |
16,000 |
|
|
|
Other selling expenses |
18,000 |
|
|
|
Total selling expenses |
|
|
65,000 |
|
General and administrative expenses |
|
|
|
|
Professional and office salaries |
|
20,500 |
|
|
Utilities |
|
5,000 |
|
|
Office supplies |
|
1,500 |
|
|
Interest |
|
3,600 |
|
|
Insurance |
|
2,500 |
|
|
Rent |
|
17,000 |
|
|
Total general and administrative expenses |
|
50,100 |
|
|
Total operating expenses |
|
115,100 |
|
|
Net profit before taxes |
|
42,900 |
|
|
Less: Income taxes |
|
10,725 |
|
|
Net profit |
|
32,175 |
|
Revenues
Revenues are the dollar amount of sales plus any other income received from sources such as interest, dividends, and rents. The revenues of Delicious Desserts arise from sales of its bakery products. Revenues are determined starting with gross sales, the total dollar amount of a company’s sales. Delicious Desserts had two deductions from gross sales. Sales discounts are price reductions given to customers that pay their bills early. For example, Delicious Desserts gives sales discounts to restaurants that buy in bulk and pay at delivery. Returns and allowances is the dollar amount of merchandise returned by customers because they didn’t like a product or because it was damaged or defective. Net sales is the amount left after deducting sales discounts and returns and allowances from gross sales. Delicious Desserts’ gross sales were reduced by $4,500, leaving net sales of $270,500.
Expenses
Expenses are the costs of generating revenues. Two types are recorded on the income statement: cost of goods sold and operating expenses.

The cost of goods sold is the total expense of buying or producing the firm’s goods or services. For manufacturers, cost of goods sold includes all costs directly related to production: purchases of raw materials and parts, labor, and factory overhead (utilities, factory maintenance, machinery repair). For wholesalers and retailers, it is the cost of goods bought for resale. For all sellers, cost of goods sold includes all the expenses of preparing the goods for sale, such as shipping and packaging.
Delicious Desserts’ cost of goods sold is based on the value of inventory on hand at the beginning of the accounting period, $18,000. During the year, the company spent $109,500 to produce its baked goods. This figure includes the cost of raw materials, labor costs for bakery workers, and the cost of operating the bakery area (Figure 15.5). Adding the cost of goods manufactured to the value of beginning inventory, we get the total cost of goods available for sale, $127,500. To determine the cost of goods sold for the year, we subtract the cost of inventory at the end of the period:
$127,500 − $15,000 = $112,500
The amount a company earns after paying to produce or buy its products but before deducting operating expenses is the gross profit. It is the difference between net sales and cost of goods sold. Because service firms do not produce goods, their gross profit equals net sales. Gross profit is a critical number for a company because it is the source of funds to cover all the firm’s other expenses.
The other major expense category is operating expenses. These are the expenses of running the business that are not related directly to producing or buying its products. The two main types of operating expenses are selling expenses and general and administrative expenses. Selling expenses are those related to marketing and distributing the company’s products. They include salaries and commissions paid to salespeople and the costs of advertising, sales supplies, delivery, and other items that can be linked to sales activity, such as insurance, telephone and other utilities, and postage. General and administrative expenses are the business expenses that cannot be linked to either cost of goods sold or sales. Examples of general and administrative expenses are salaries of top managers and office support staff; utilities; office supplies; interest expense; fees for accounting, consulting, and legal services; insurance; and rent. Delicious Desserts’ operating expenses totaled $115,100.
Net Profit or Loss
The final figure—or bottom line—on an income statement is the net profit (or net income), or net loss. It is calculated by subtracting all expenses from revenues. If revenues are more than expenses, the result is a net profit. If expenses exceed revenues, a net loss results.
Several steps are involved in finding net profit or loss. First, cost of goods sold is deducted from net sales to get the gross profit. Then total operating expenses are subtracted from gross profit to get the net profit before taxes. Finally, income taxes are deducted to get the net profit. As shown in Table 15.2, Delicious Desserts earned a net profit of $32,175 in 2022.
It is very important to recognize that profit does not represent cash. The income statement is a summary of the firm’s operating results during some time period. It does not present the firm’s actual cash flows during the period. Those are summarized in the statement of cash flows, which is discussed briefly in the next section.
Before continuing, take a moment to review components of the income statement:
The Statement of Cash Flows
Net profit or loss is one measure of a company’s financial performance. However, creditors and investors are also keenly interested in how much cash a business generates and how it is used. The statement of cash flows, a summary of the money flowing into and out of a firm, is the financial statement used to assess the sources and uses of cash during a certain period, typically one year. All publicly traded firms must include a statement of cash flows in their financial reports to shareholders. The statement of cash flows tracks the firm’s cash receipts and cash payments. It gives financial managers and analysts a way to identify cash flow problems and assess the firm’s financial viability.
Using income statement and balance sheet data, the statement of cash flows divides the firm’s cash flows into three groups:
Cash flow from operating activities: Those related to the production of the firm’s goods or services.
Cash flow from investment activities: Those related to the purchase and sale of fixed assets.
Cash flow from financing activities: Those related to debt and equity financing.
Delicious Desserts’ statement of cash flows for 2022 is presented in Table 15.3. It shows that the company’s cash and marketable securities have increased over the last year. And during the year the company generated enough cash flow to increase inventory and fixed assets and to reduce accounts payable, accruals, notes payable, and long-term debt. Note that the parentheses used around numbers represent negative numbers, or cash outflows.
|
Delicious Desserts, Inc. Statement of Cash Flows for 2023 |
||
|
Cash Flow from Operating Activities |
|
|
|
Net profit after taxes |
32,175 |
|
|
Depreciation |
1,500 |
|
|
Decrease in accounts receivable |
3,140 |
|
|
Increase in inventory |
(4,500) |
|
|
Decrease in accounts payable |
(2,065) |
|
|
Decrease in accruals |
(1,035) |
|
|
Cash provided by operating activities |
|
29,215 |
|
Cash Flow from Investment Activities |
|
|
|
Increase in gross fixed assets |
(5,000) |
|
|
Cash used in investment activities |
|
(5,000) |
|
Cash Flow from Financing Activities |
|
|
|
Decrease in notes payable |
(3,000) |
|
|
Decrease in long-term debt |
(1,000) |
|
|
Cash used by financing activities |
|
(4,000) |
|
Net increase in cash and marketable securities |
|
$20,215 |
Before continuing, take a moment to review the three components of the statement of cash flows, as well as the three financial statements:
Analyzing Financial Statements
Individually, the balance sheet, income statement, and statement of cash flows provide insight into the firm’s operations, profitability, and overall financial condition. By studying the relationships among the financial statements, however, one can gain even more insight into a firm’s financial condition and performance. Financial statements at any given time can provide a snapshot of a company’s overall health. Company management must use certain standards and measurements to determine whether they need to implement additional strategies to keep the company fit and making a profit.
Ratio analysis involves calculating and interpreting financial ratios using data taken from the firm’s financial statements in order to assess its condition and performance. A financial ratio states the relationship between financial data on a percentage basis. The ratios can then be compared over time, typically three to five years. A firm’s ratios can also be compared to industry averages or to those of another company in the same industry. Period-to-period and industry ratios provide a meaningful basis for comparison, so that we can answer questions such as, “Is this particular ratio good or bad?”
It’s important to remember that ratio analysis is based on historical data and may not indicate future financial performance. Ratio analysis merely highlights potential problems; it does not prove that they exist. However, ratios can help managers monitor the firm’s performance from period to period to understand operations better and identify trouble spots.
Ratios are also important to a firm’s present and prospective creditors (lenders), who want to see if the firm can repay what it borrows and assess the firm’s financial health. Often loan agreements require firms to maintain minimum levels of specific ratios. Both present and prospective shareholders use ratio analysis to look at the company’s historical performance and trends over time.
Ratios can be classified by what they measure: liquidity, profitability, activity, and debt. Using Delicious Desserts’ 2022 balance sheet and income statement (Table 15.1 and Table 15.2), we can calculate and interpret the key ratios in each group. Table 15.4 summarizes the calculations of these ratios for Delicious Desserts.
|
Ratio Analysis for Delicious Desserts, Inc. at Year-End 2022 |
|||
|
Ratio |
Formula |
Calculation |
Result |
| Liquidity Ratios | |||
| Current ratio |
Total current assets / Total current liabilities |
$83,200 / $60,150 |
1.4 |
| Acid-test (quick) ratio |
(Total current assets – inventory) / Total current liabilities |
($83,200 – $15,000) / $60,150 |
1.1 |
| Net working capital |
Total current assets – Total current liabilities |
$83,200 – $60,150 |
$23,050 |
| Profitability Ratios | |||
| Net profit margin |
Net profit / Net sales |
$32,175 / $270,500 |
11.9% |
| Return on equity |
Net profit / Total owners’ equity |
$32,175 / $78,750 |
40.9% |
| Earnings per share |
Net profit / # of shares of common stock outstanding |
$32,17 / 510,000 |
$3.22 |
| Activity Ratio | |||
| Inventory turnover |
Cost of goods sold / Average inventory |
|
|
|
|
Cost of goods sold / (Beginning inventory + (Ending inventory/2)) |
$112,500 / ($18,000 + ($15,000/2)) |
|
|
|
|
$112,500 / $16,500 |
6.8 times |
| Debt Ratio | |||
| Debt-to-equity ratio |
Total liabilities / Owners’ equity |
$70,150 / $78,750 |
89.1% |
We’ll now discuss how to calculate the ratios and how to interpret the ratio value.
Liquidity Ratios
Liquidity ratios measure the firm’s ability to pay its short-term debts as they come due. These ratios are of special interest to the firm’s creditors. The three main measures of liquidity are the current ratio, the acid-test (quick) ratio, and net working capital.
The current ratio is the ratio of total current assets to total current liabilities. Traditionally, a current ratio of 2 ($2 of current assets for every $1 of current liabilities) has been considered good. Whether it is sufficient depends on the industry in which the firm operates. Public utilities, which have a very steady cash flow, operate quite well with a current ratio well below 2. A current ratio of 2 might not be adequate for manufacturers and merchandisers that carry high inventories and have lots of receivables. The current ratio for Delicious Desserts for 2022, as shown in Table 15.4, is 1.4. This means little without a basis for comparison. If the analyst found that the industry average for small bakeries was 2.4, Delicious Desserts would appear to have low liquidity.
The acid-test (quick) ratio is like the current ratio except that it excludes inventory, which is the least-liquid current asset. The acid-test ratio is used to measure the firm’s ability to pay its current liabilities without selling inventory. The name acid-test implies that this ratio is a crucial test of the firm’s liquidity. An acid-test ratio of at least 1 is preferred. But again, what is an acceptable value varies by industry. The acid-test ratio is a good measure of liquidity when inventory cannot easily be converted to cash (for instance, if it consists of very specialized goods with a limited market). If inventory is liquid, the current ratio is better. Delicious Desserts’ acid-test ratio for 2022 is 1.1. Because the bakery’s products are perishable, it does not carry large inventories. Thus, the values of its acid-test and current ratios are fairly close. At a manufacturing company, however, inventory typically makes up a large portion of current assets, so the acid-test ratio will be lower than the current ratio.
Net working capital, though not really a ratio, is often used to measure a firm’s overall liquidity. It is calculated by subtracting total current liabilities from total current assets. Delicious Desserts’ net working capital for 2022 is $23,050. Comparisons of net working capital over time often help in assessing a firm’s liquidity.
Profitability Ratios
To measure profitability, a firm’s profits can be related to its sales, equity, or stock value. Profitability ratios measure how well the firm is using its resources to generate profit and how efficiently it is being managed. The main profitability ratios are net profit margin, return on equity, and earnings per share.
The ratio of net profit to net sales is the net profit margin, also called return on sales. It measures the percentage of each sales dollar remaining after all expenses, including taxes, have been deducted. Higher net profit margins are better than lower ones. The net profit margin is often used to measure the firm’s earning power. “Good” net profit margins differ quite a bit from industry to industry. A grocery store usually has a very low net profit margin, perhaps below 1 percent, whereas a jewelry store’s net profit margin would probably exceed 10 percent. Delicious Desserts’ net profit margin for 2022 is 11.9 percent. In other words, Delicious Desserts is earning 11.9 cents on each dollar of sales.
The ratio of net profit to total owners’ equity is called return on equity (ROE). It measures the return that owners receive on their investment in the firm, a major reason for investing in a company’s stock. Delicious Desserts has a 40.9 percent ROE for 2022. On the surface, a 40.9 percent ROE seems quite good. But the level of risk in the business and the ROE of other firms in the same industry must also be considered. The higher the risk, the greater the ROE investors look for. A firm’s ROE can also be compared to past values to see how the company is performing over time.
Earnings per share (EPS) is the ratio of net profit to the number of shares of common stock outstanding. It measures the number of dollars earned by each share of stock. EPS values are closely watched by investors and are considered an important sign of success. EPS also indicates a firm’s ability to pay dividends. Note that EPS is the dollar amount earned by each share, not the actual amount given to stockholders in the form of dividends. Some earnings may be put back into the firm. Delicious Desserts’ EPS for 2022 is $3.22.
Activity Ratios
Activity ratios measure how well a firm uses its assets. They reflect the speed with which resources are converted to cash or sales. A frequently used activity ratio is inventory turnover. The inventory turnover ratio measures the speed with which inventory moves through the firm and is turned into sales. It is calculated by dividing cost of goods sold by the average inventory. (Average inventory is estimated by adding the beginning and ending inventories for the year and dividing by 2.) Based on its 2022 financial data, Delicious Desserts’ inventory, on average, is turned into sales 6.8 times each year, or about once every 54 days (365 days ÷ 6.8). The acceptable turnover ratio depends on the line of business. A grocery store would have a high turnover ratio, maybe 20 times a year, whereas the turnover for a heavy equipment manufacturer might be only three times a year.
Debt Ratios
Debt ratios measure the degree and effect of the firm’s use of borrowed funds (debt) to finance its operations. These ratios are especially important to lenders and investors. They want to make sure the firm has a healthy mix of debt and equity. If the firm relies too much on debt, it may have trouble meeting interest payments and repaying loans. The most important debt ratio is the debt-to-equity ratio.
The debt-to-equity ratio measures the relationship between the amount of debt financing (borrowing) and the amount of equity financing (owners’ funds). It is calculated by dividing total liabilities by owners’ equity. In general, the lower the ratio, the better. But it is important to assess the debt-to-equity ratio against both past values and industry averages. Delicious Desserts’ ratio for 2022 is 89.1 percent. The ratio indicates that the company has 89 cents of debt for every dollar the owners have provided. A ratio above 100 percent means the firm has more debt than equity. In such a case, the lenders are providing more financing than the owners.
The Accounting Profession
Public Accountants
Independent accountants who serve organizations and individuals on a fee basis are called public accountants. Public accountants offer a wide range of services, including preparation of financial statements and tax returns, independent auditing of financial records and accounting methods, and management consulting. Auditing, the process of reviewing the records used to prepare financial statements, is an important responsibility of public accountants. They issue a formal auditor’s opinion indicating whether the statements have been prepared in accordance with accepted accounting rules. This written opinion is an important part of a company’s annual report.
Private Accountants
Accountants employed to serve one particular organization are private accountants. Their activities include preparing financial statements, auditing company records to be sure employees follow accounting policies and procedures, developing accounting systems, preparing tax returns, and providing financial information for management decision-making.
Chapter Review
Watch Video 15.1: Understanding Financial Statements and Accounting to review the three financial statements. Note that this video is framed around using the financial statements in a start-up business. Closed captioning is available. Click HERE to read a transcript.
Optional Resources to Learn More
Chapter Attribution
This chapter incorporates materials from the following source:
Chapter 14 of Gitman, L. J., McDaniel, C., Shah, A., Reece, M., Koffel, L., Talsma, B., & Hyatt, J. C. (2018). Introduction to business. OpenStax. https://openstax.org/books/introduction-business/pages/14-introduction. Licensed with CC BY 4.0.
Media Attributions
Figure 15.2: Rice University. (2018, September 9). Reports provided by the financial system. OpenStax. https://openstax.org/books/introduction-business/pages/14-1-accounting-more-than-numbers#fs-idm271856800. Licensed with CC BY 4.0.
Video 15.1: CrashCourse. (2019, November 29). Understanding financial statements and accounting: Crash course entrepreneurship #15 [Video]. YouTube. https://youtu.be/_HK5gpg39pY
The process of collecting, recording, classifying, summarizing, reporting, and analyzing financial activities.
Accounting that provides financial information that managers inside the organization can use to evaluate and make decisions about current and future operations.
Accounting that focuses on preparing external financial reports that are used by outsiders such as lenders, suppliers, investors, and government agencies to assess the financial strength of a business.
A yearly document that describes a firm’s financial status.
The financial accounting standards followed by accountants in the United States when preparing financial statements.
Things of value owned by a firm. They may be tangible, such as cash, equipment, and buildings, or intangible, such as a patent or trademarked name.
What a firm owes to its creditors; also called debts.
The total amount of investment in the firm minus any liabilities; also called net worth.
A method of accounting in which each transaction is recorded as two entries so that two accounts or records are changed.
A financial statement that summarizes a firm’s financial position at a specific point in time.
The speed with which assets can be turned into cash.
Assets that can or will be converted to cash within the next 12 months.
Funds on hand or in a bank.
Temporary investments of excess cash that can readily be converted to cash.
Amounts owed to the firm by customers who bought goods or services on credit.
Amounts owed to the firm by customers or others to whom it lent money; typically longer-term than accounts receivable and includes interest.
Stock of goods being held for production or for sale to customers.
Long-term assets used by the firm for more than a year.
The allocation of the asset’s original cost to the years in which it is expected to produce revenues.
Long-term assets with no physical existence, such as patents, copyrights, trademarks, and goodwill.
Short-term claims that are due within a year of the date of the balance sheet.
Amounts the firm owes for credit purchases due within a year. This account is the liability counterpart of accounts receivable.
Formal short-term borrowings usually evidenced by a specific written promise to pay.
Expenses, typically for wages and taxes, that have accumulated and must be paid at a specified future date within the year although the firm has not received a bill.
Taxes owed for the current operating period but not yet paid. Taxes are often shown separately when they are a large amount.
Any repayment on long-term debt due within the year.
Claims that come due more than one year after the date of the balance sheet.
The amounts left over from profitable operations since the firm’s beginning; equal to total profits minus all dividends paid to stockholders.
A financial statement that summarizes a firm’s revenues and expenses and shows its total profit or loss over a period of time.
The dollar amount of a firm’s sales plus any other income it received from sources such as interest, dividends, and rents.
The total dollar amount of a company’s sales.
The amount left after deducting sales discounts and returns and allowances from gross sales.
The costs of generating revenues.
The total expense of buying or producing a firm’s goods or services.
The amount a company earns after paying to produce or buy its products but before deducting operating expenses.
The expenses of running a business that are not directly related to producing or buying its products.
Related to marketing and distributing the company’s products. They include salaries and commissions paid to salespeople and the costs of advertising, sales supplies, delivery, and other items that can be linked to sales activity, such as insurance, telephone and other utilities, and postage.
Business expenses that cannot be linked to either cost of goods sold or sales. Examples of general and administrative expenses are salaries of top managers and office support staff; utilities; office supplies; interest expense; fees for accounting, consulting, and legal services; insurance; and rent.
The amount obtained by subtracting all of a firm’s expenses from its revenues, when the revenues are more than the expenses.
The amount obtained by subtracting all of a firm’s expenses from its revenues, when the expenses are more than the revenues.
A financial statement that provides a summary of the money flowing into and out of a firm during a certain period, typically one year.
Cash flows related to the production of the firm’s goods or services.
Cash flows related to the purchase and sale of fixed assets.
Cash flows related to debt and equity financing.
The calculation and interpretation of financial ratios using data taken from the firm’s financial statements in order to assess its condition and performance.
Ratios that measure a firm’s ability to pay its short-term debts as they come due.
The ratio of total current assets to total current liabilities; used to measure a firm’s liquidity.
The ratio of total current assets excluding inventory to total current liabilities; used to measure a firm’s liquidity.
The amount obtained by subtracting total current liabilities from total current assets; used to measure a firm’s liquidity.
Ratios that measure how well a firm is using its resources to generate profit and how efficiently it is being managed.
The ratio of net profit to net sales; also called return on sales. It measures the percentage of each sales dollar remaining after all expenses, including taxes, have been deducted.
The ratio of net profit to total owners’ equity; measures the return that owners receive on their investment in the firm.
The ratio of net profit to the number of shares of common stock outstanding; measures the number of dollars earned by each share of stock.
Ratios that measure how well a firm uses its assets.
The ratio of cost of goods sold to average inventory; measures the speed with which inventory moves through a firm and is turned into sales.
Ratios that measure the degree and effect of a firm’s use of borrowed funds (debt) to finance its operations.
The ratio of total liabilities to owners’ equity; measures the relationship between the amount of debt financing (borrowing) and the amount of equity financing (owner’s funds).
Independent accountants who serve organizations and individuals on a fee basis.
The process of reviewing the records used to prepare financial statements and issuing a formal auditor’s opinion indicating whether the statements have been prepared in accordance with accepted accounting rules.
Accountants who are employed to serve one particular organization.
